2.3. Main Page Overview
2.3.1. Dashboard
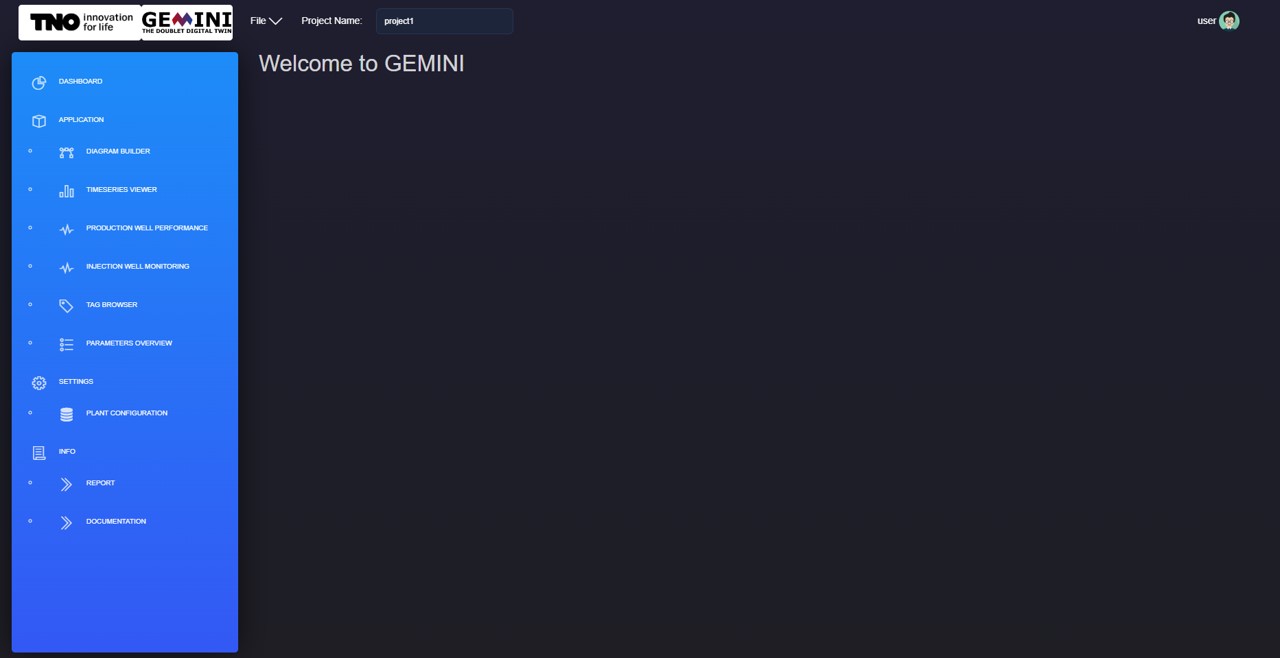
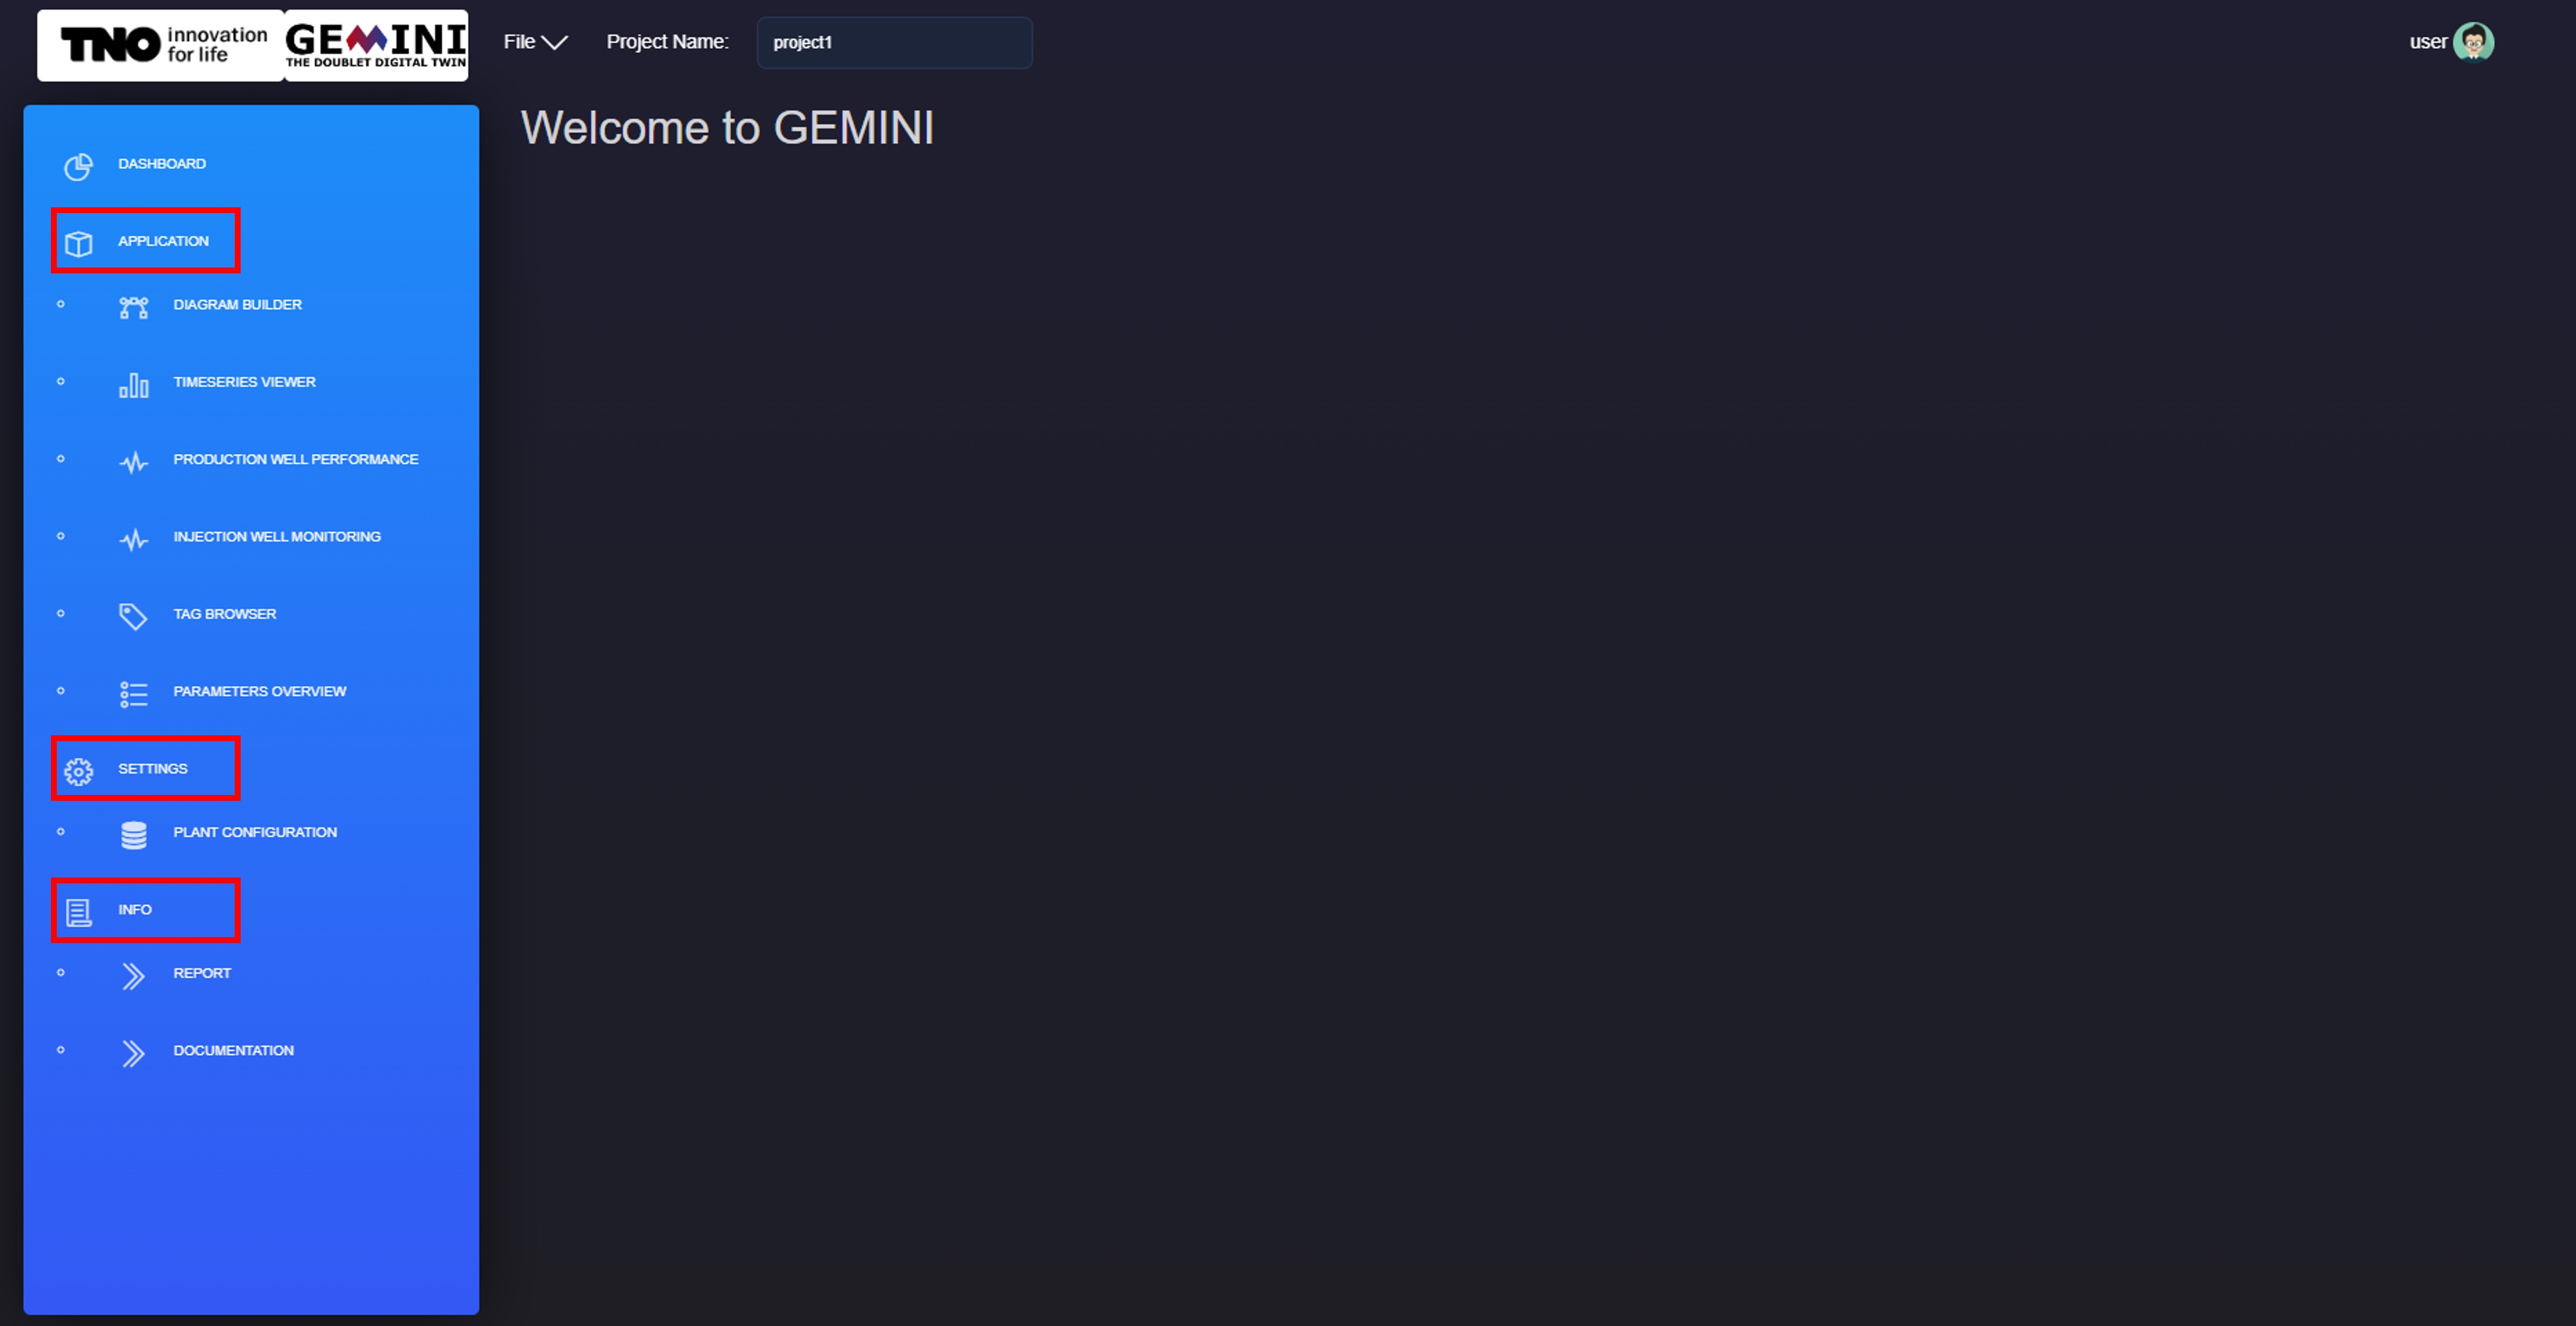
On the main page, once a project is open, you can see the dashboard, which includes “Applications,” “Settings,” and “Info” sections. Each section is explained below
2.3.2. Applications
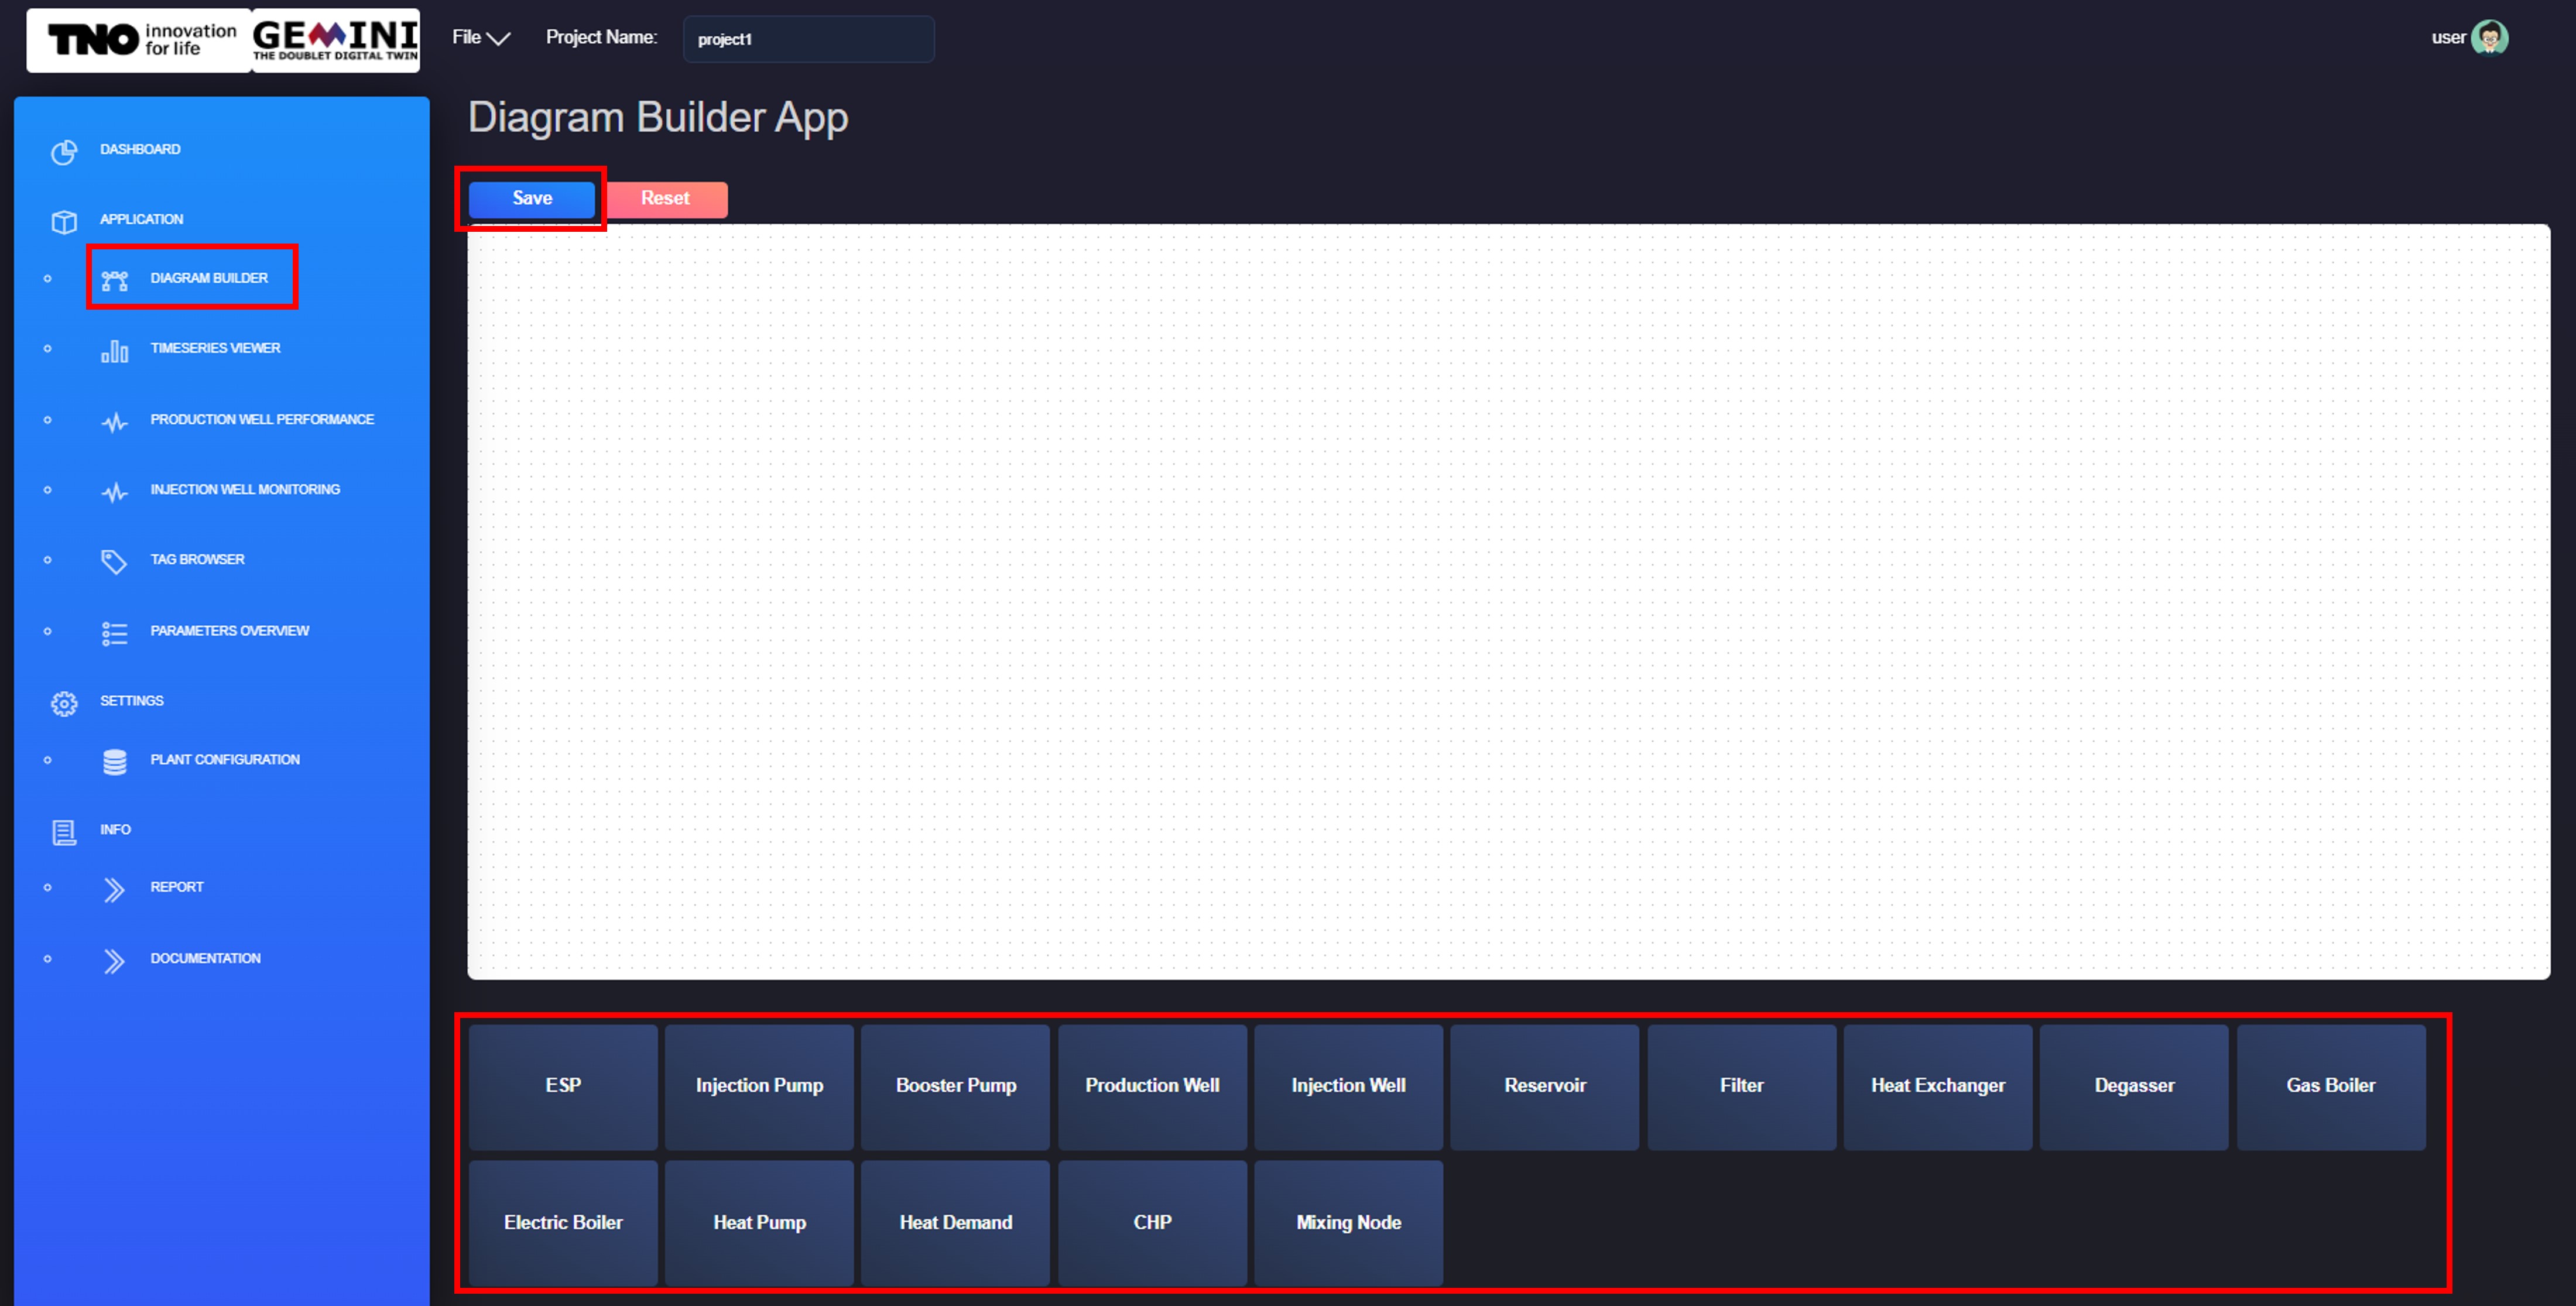
- Diagram Builder:
Visualize the components in a plant and assign parameters to each component.
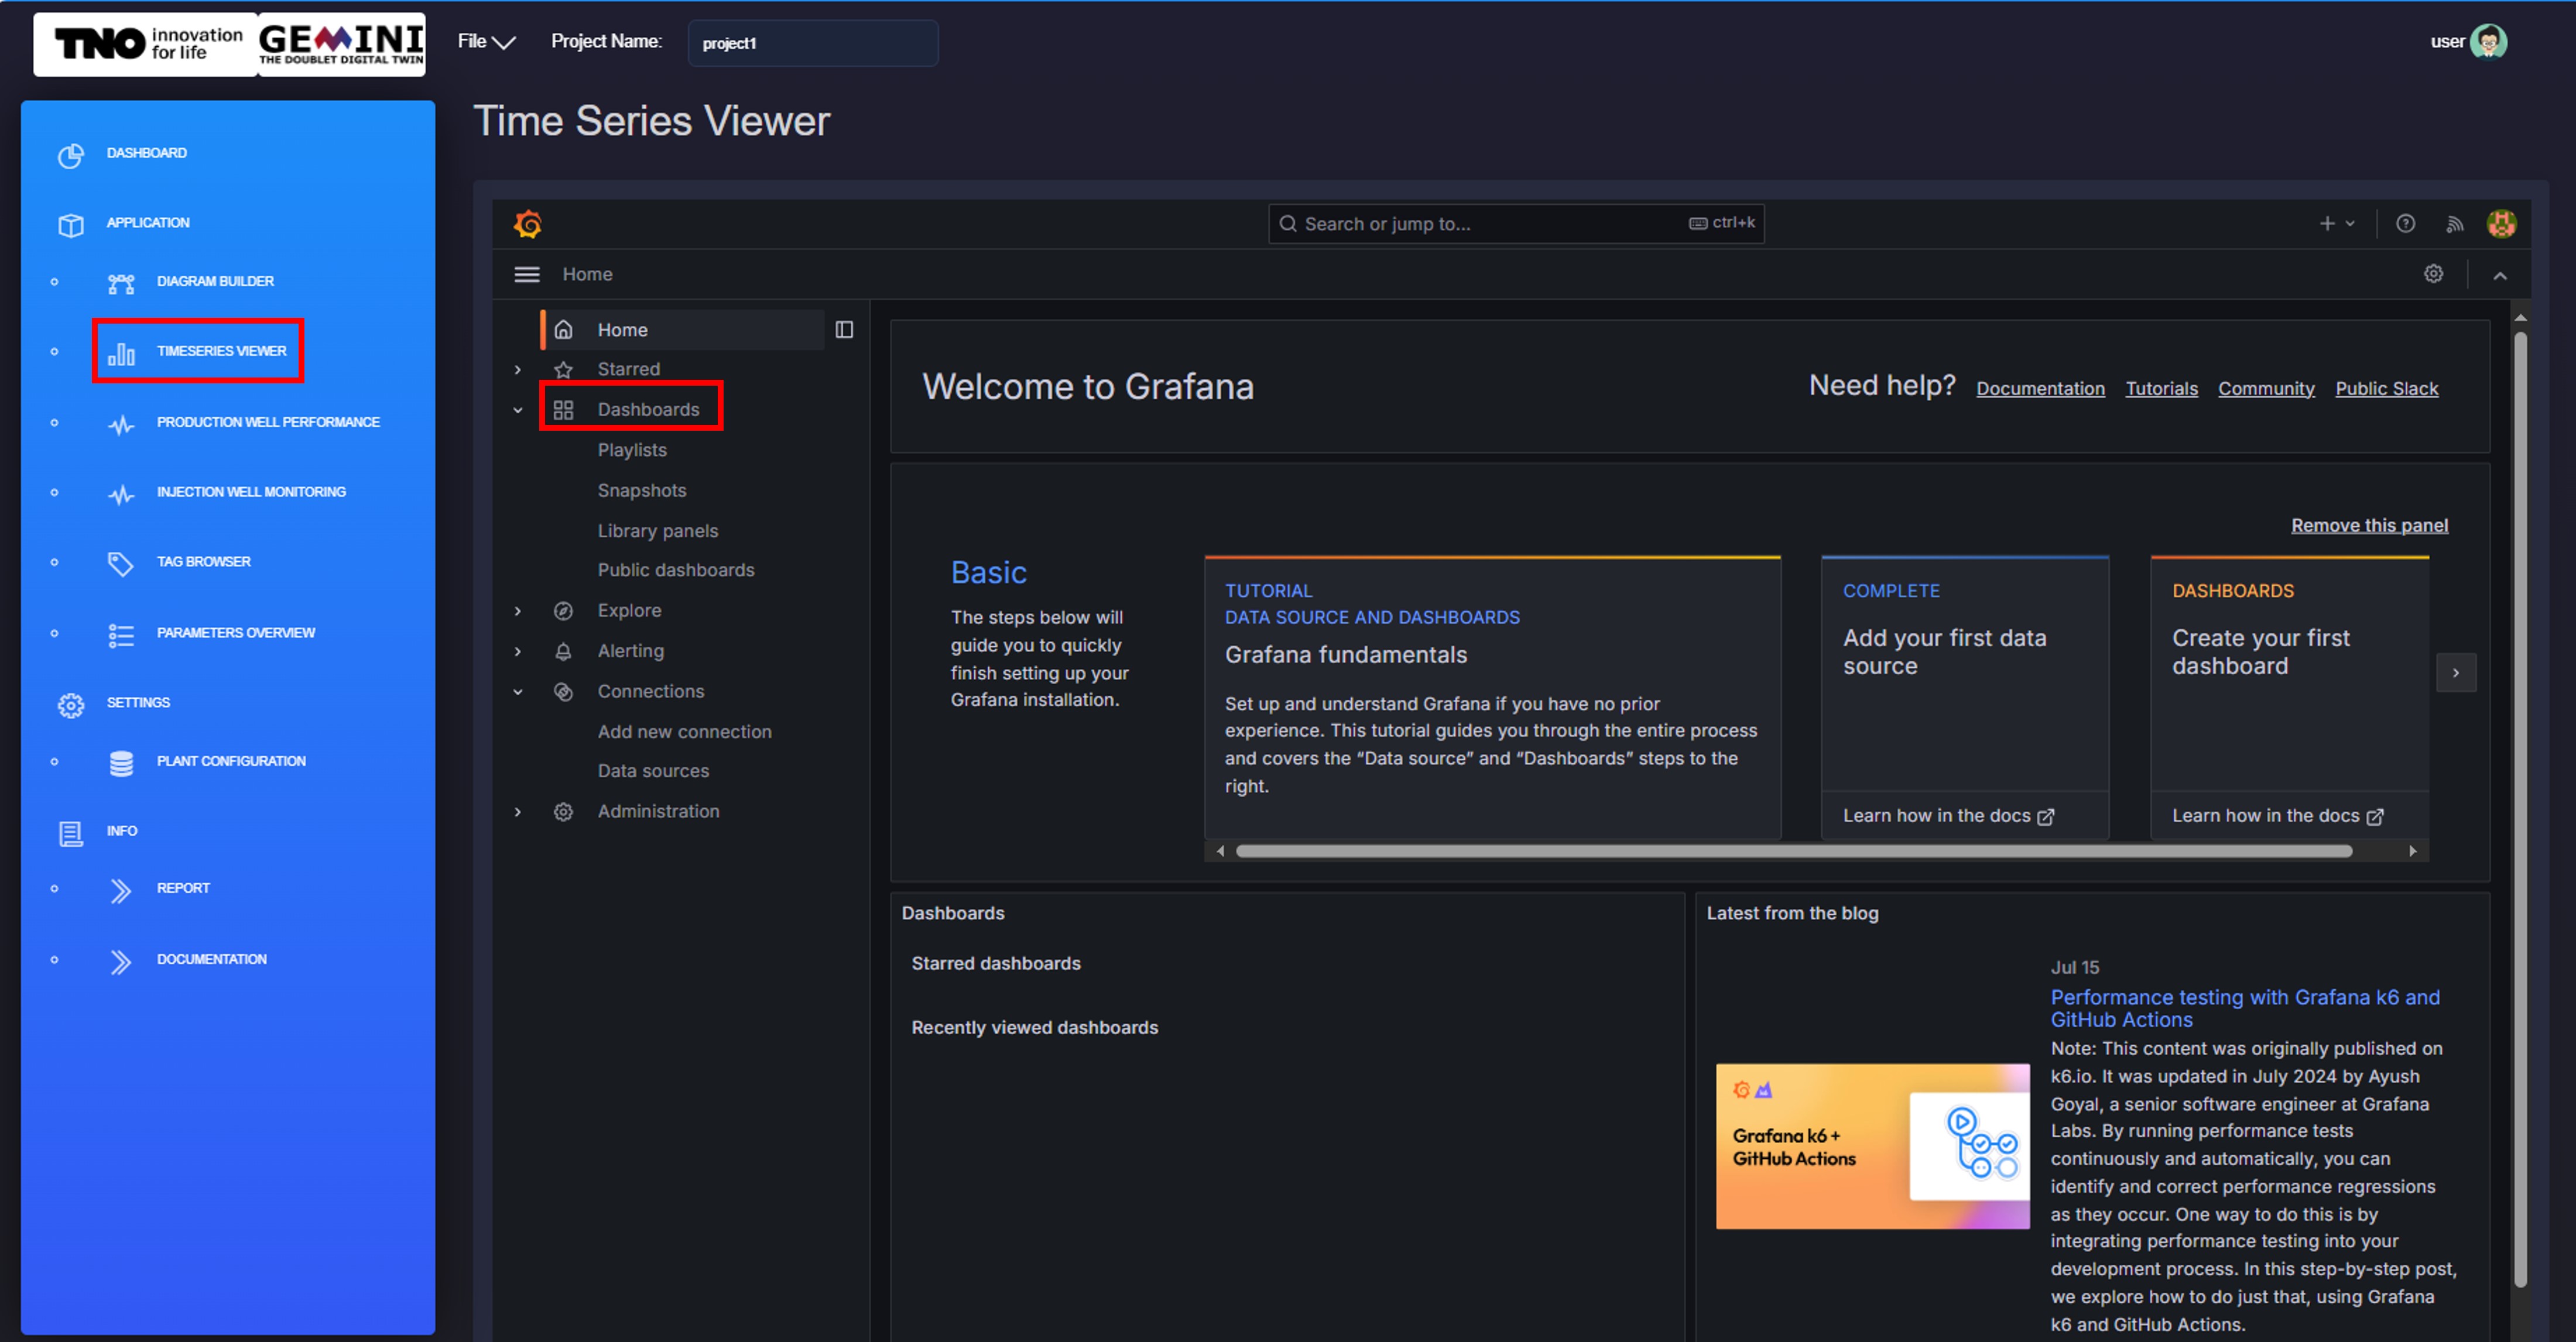
- Timeseries Viewer:
Connects to Grafana for real-time monitoring of measured or calculated parameters or properties via the module layer. Instructions on how to use Grafana can be found Time Series Viewer.
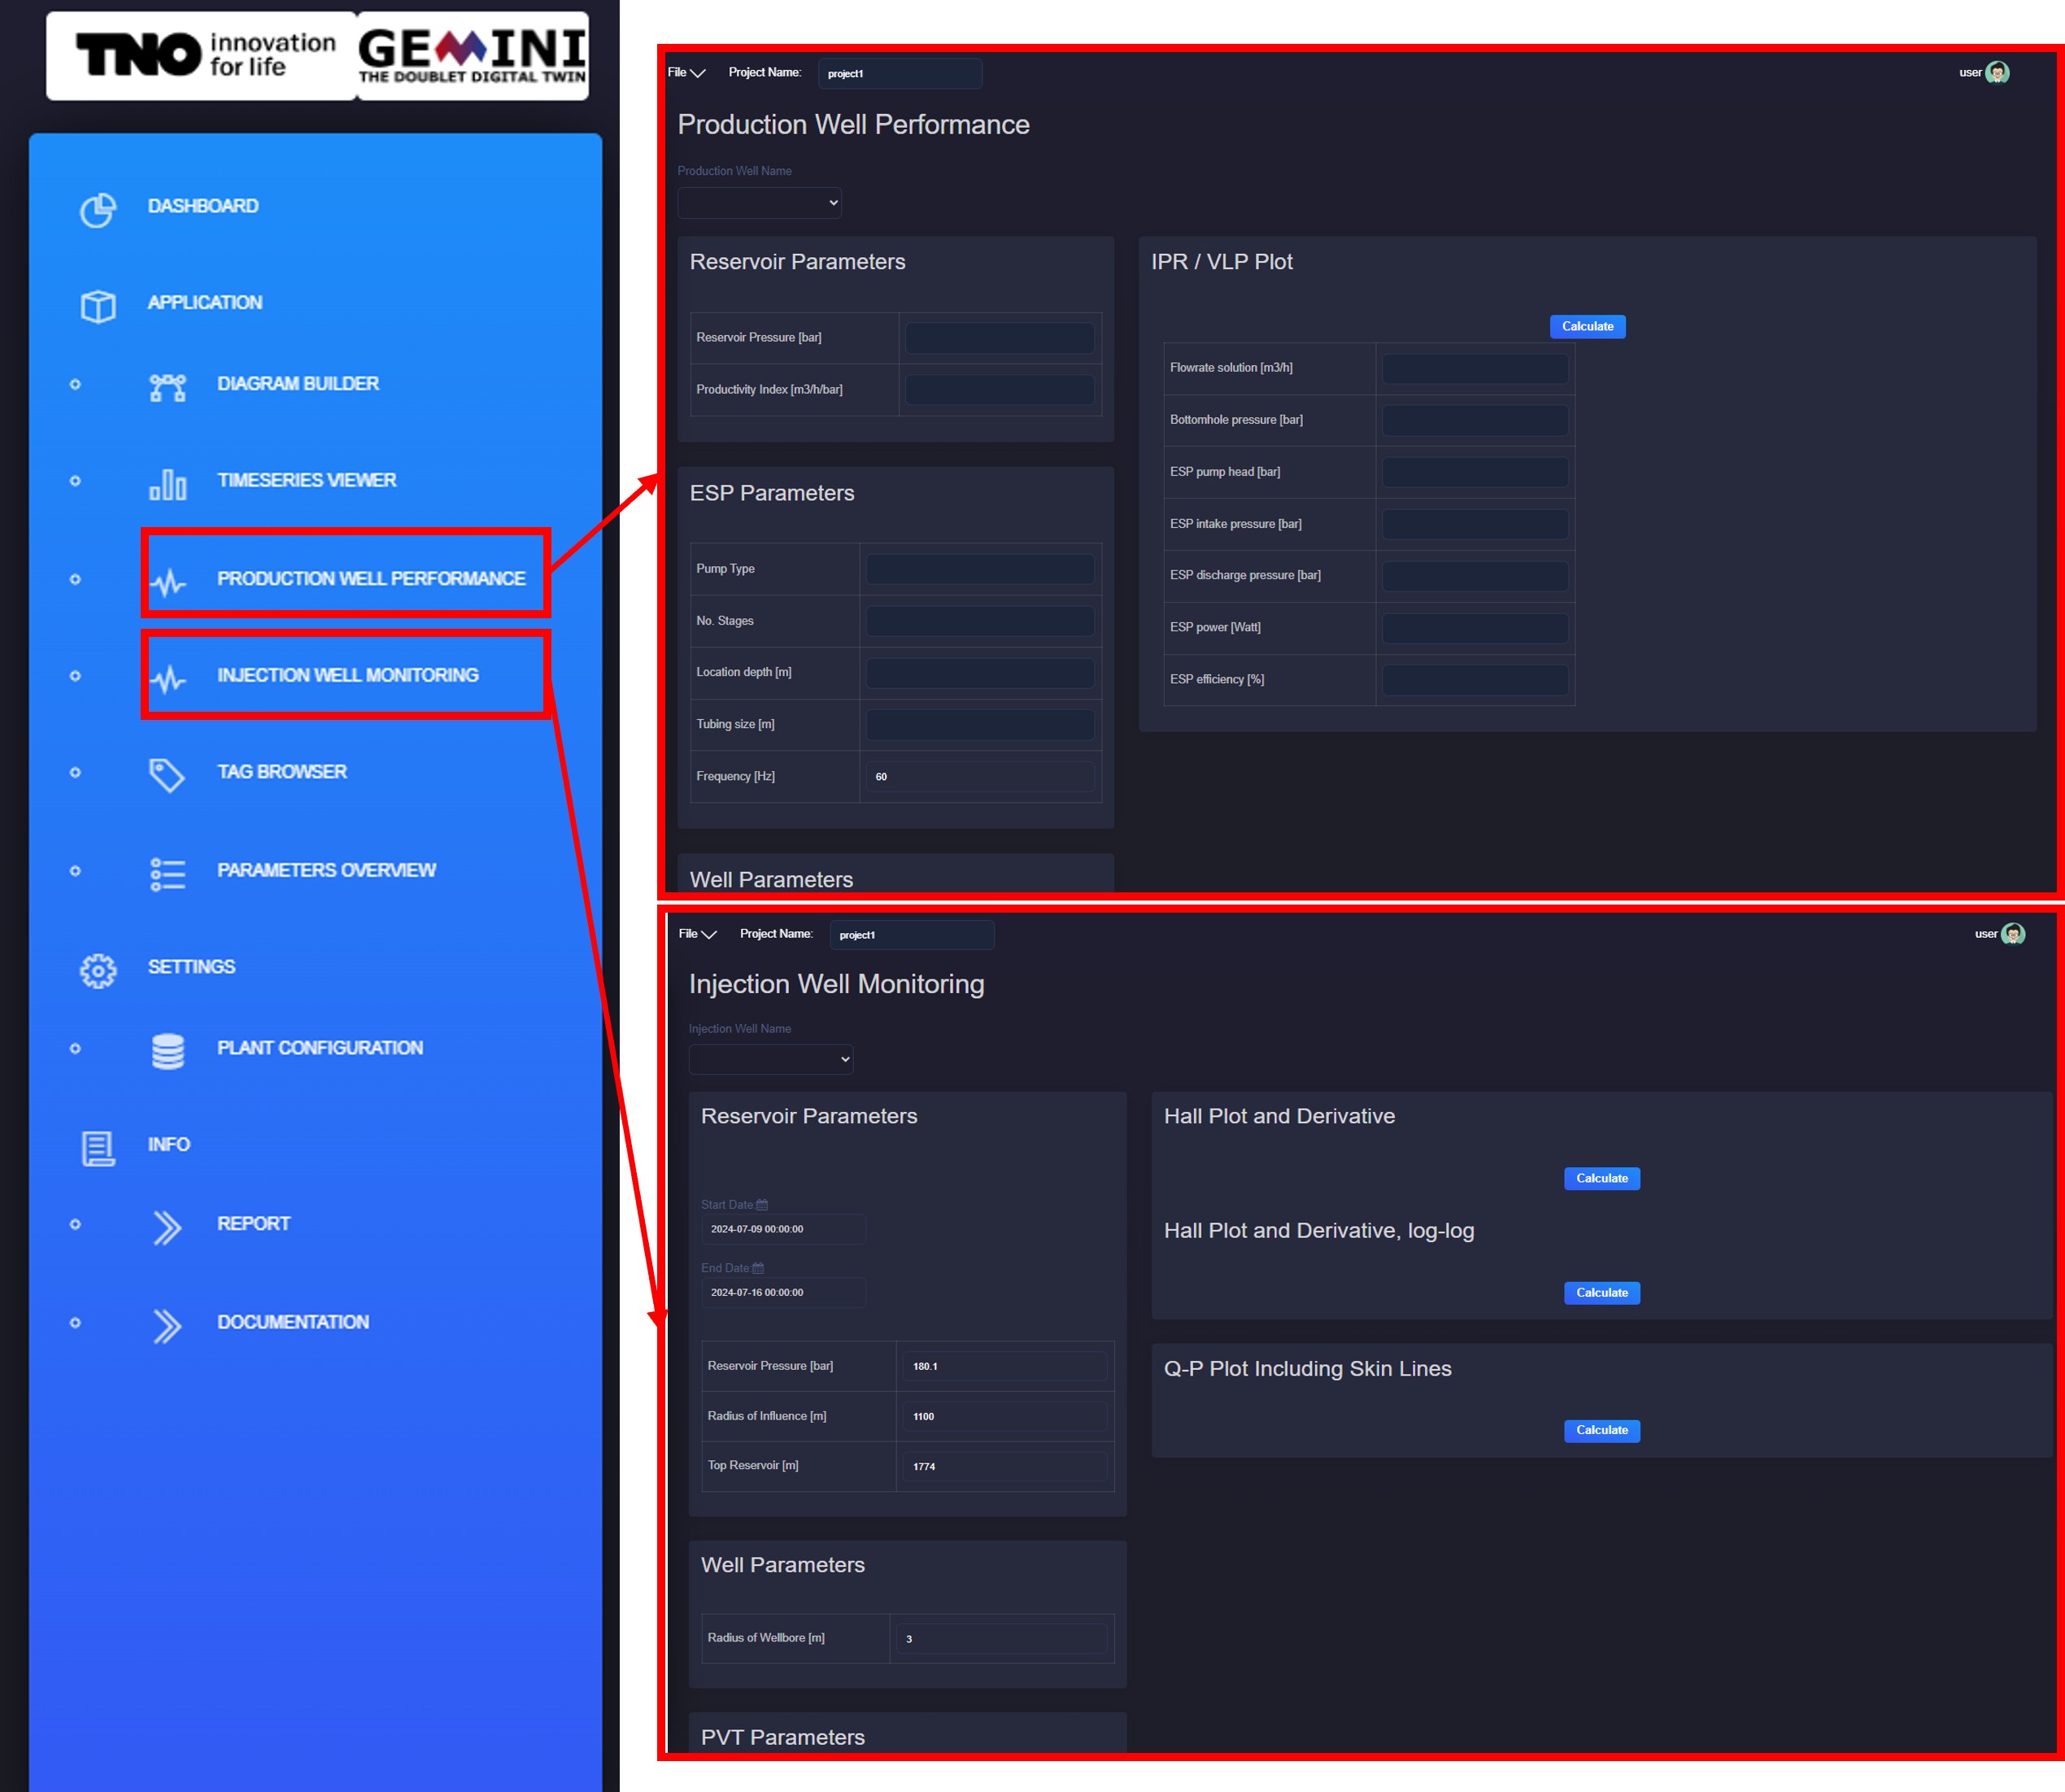
Production Well Performance and Injection Well Monitoring:
Contains applications for monitoring injection or production well performance (e.g., IPR/VLP plot, Hall plot, and skin effect). More details can be found Applications.
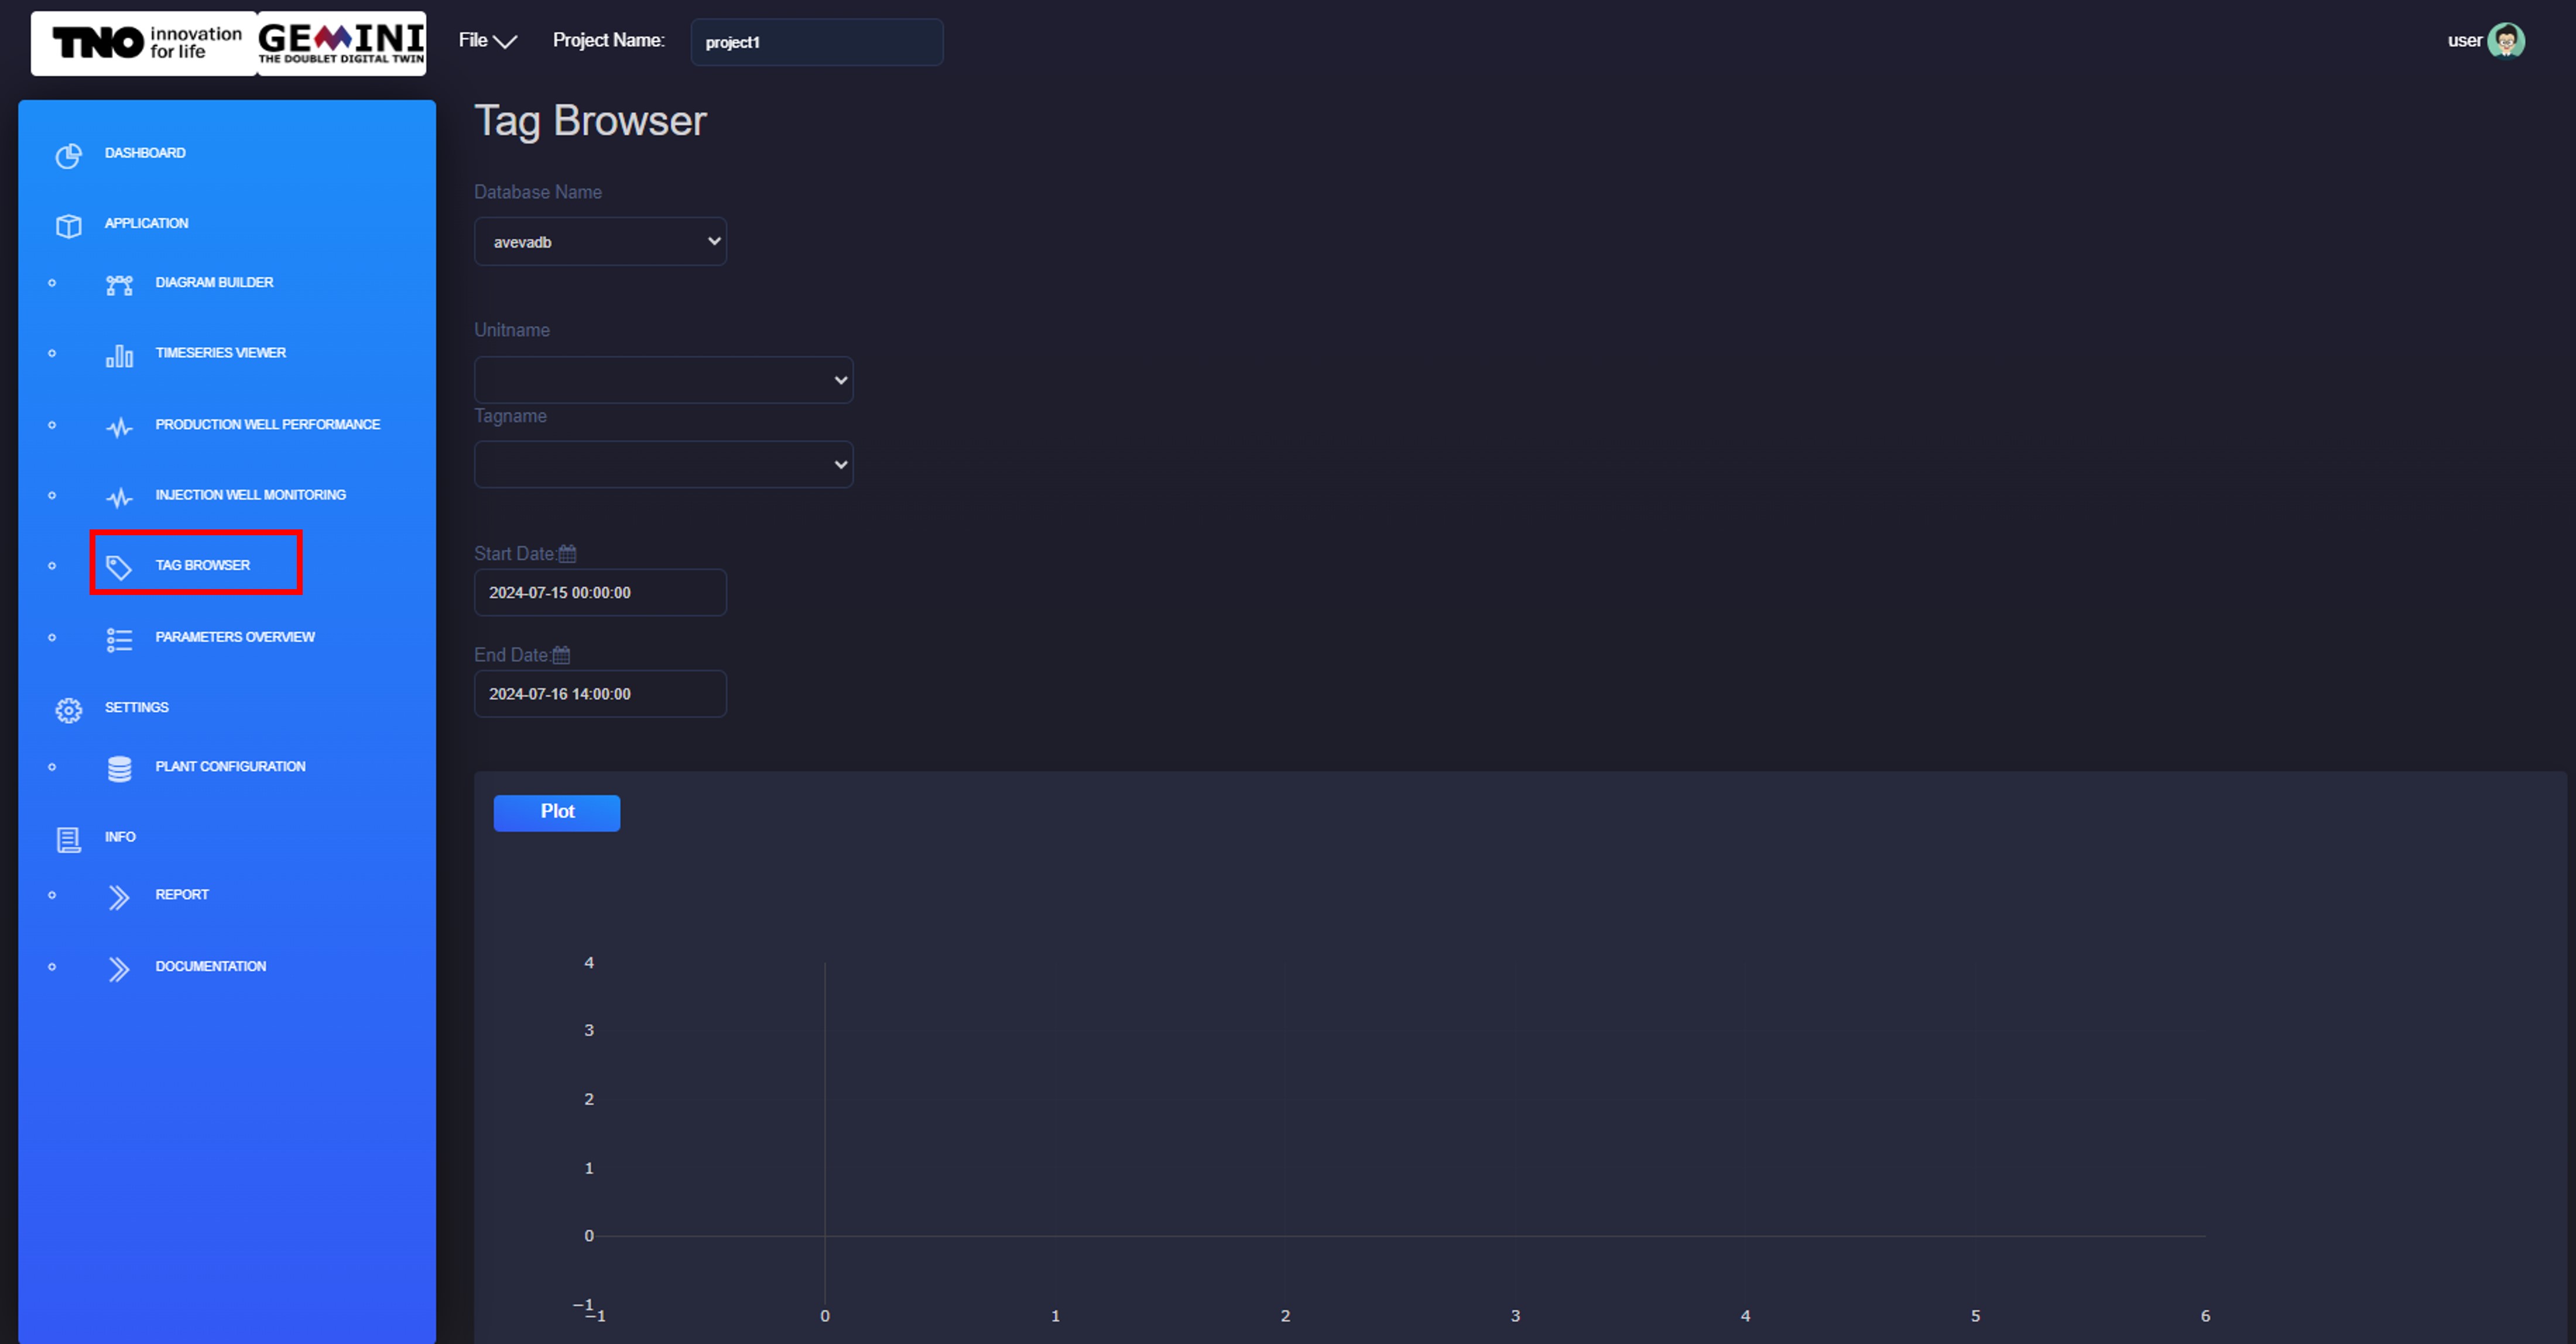
Tag Browser:
Plot measured or calculated properties for a component over a specific time duration.
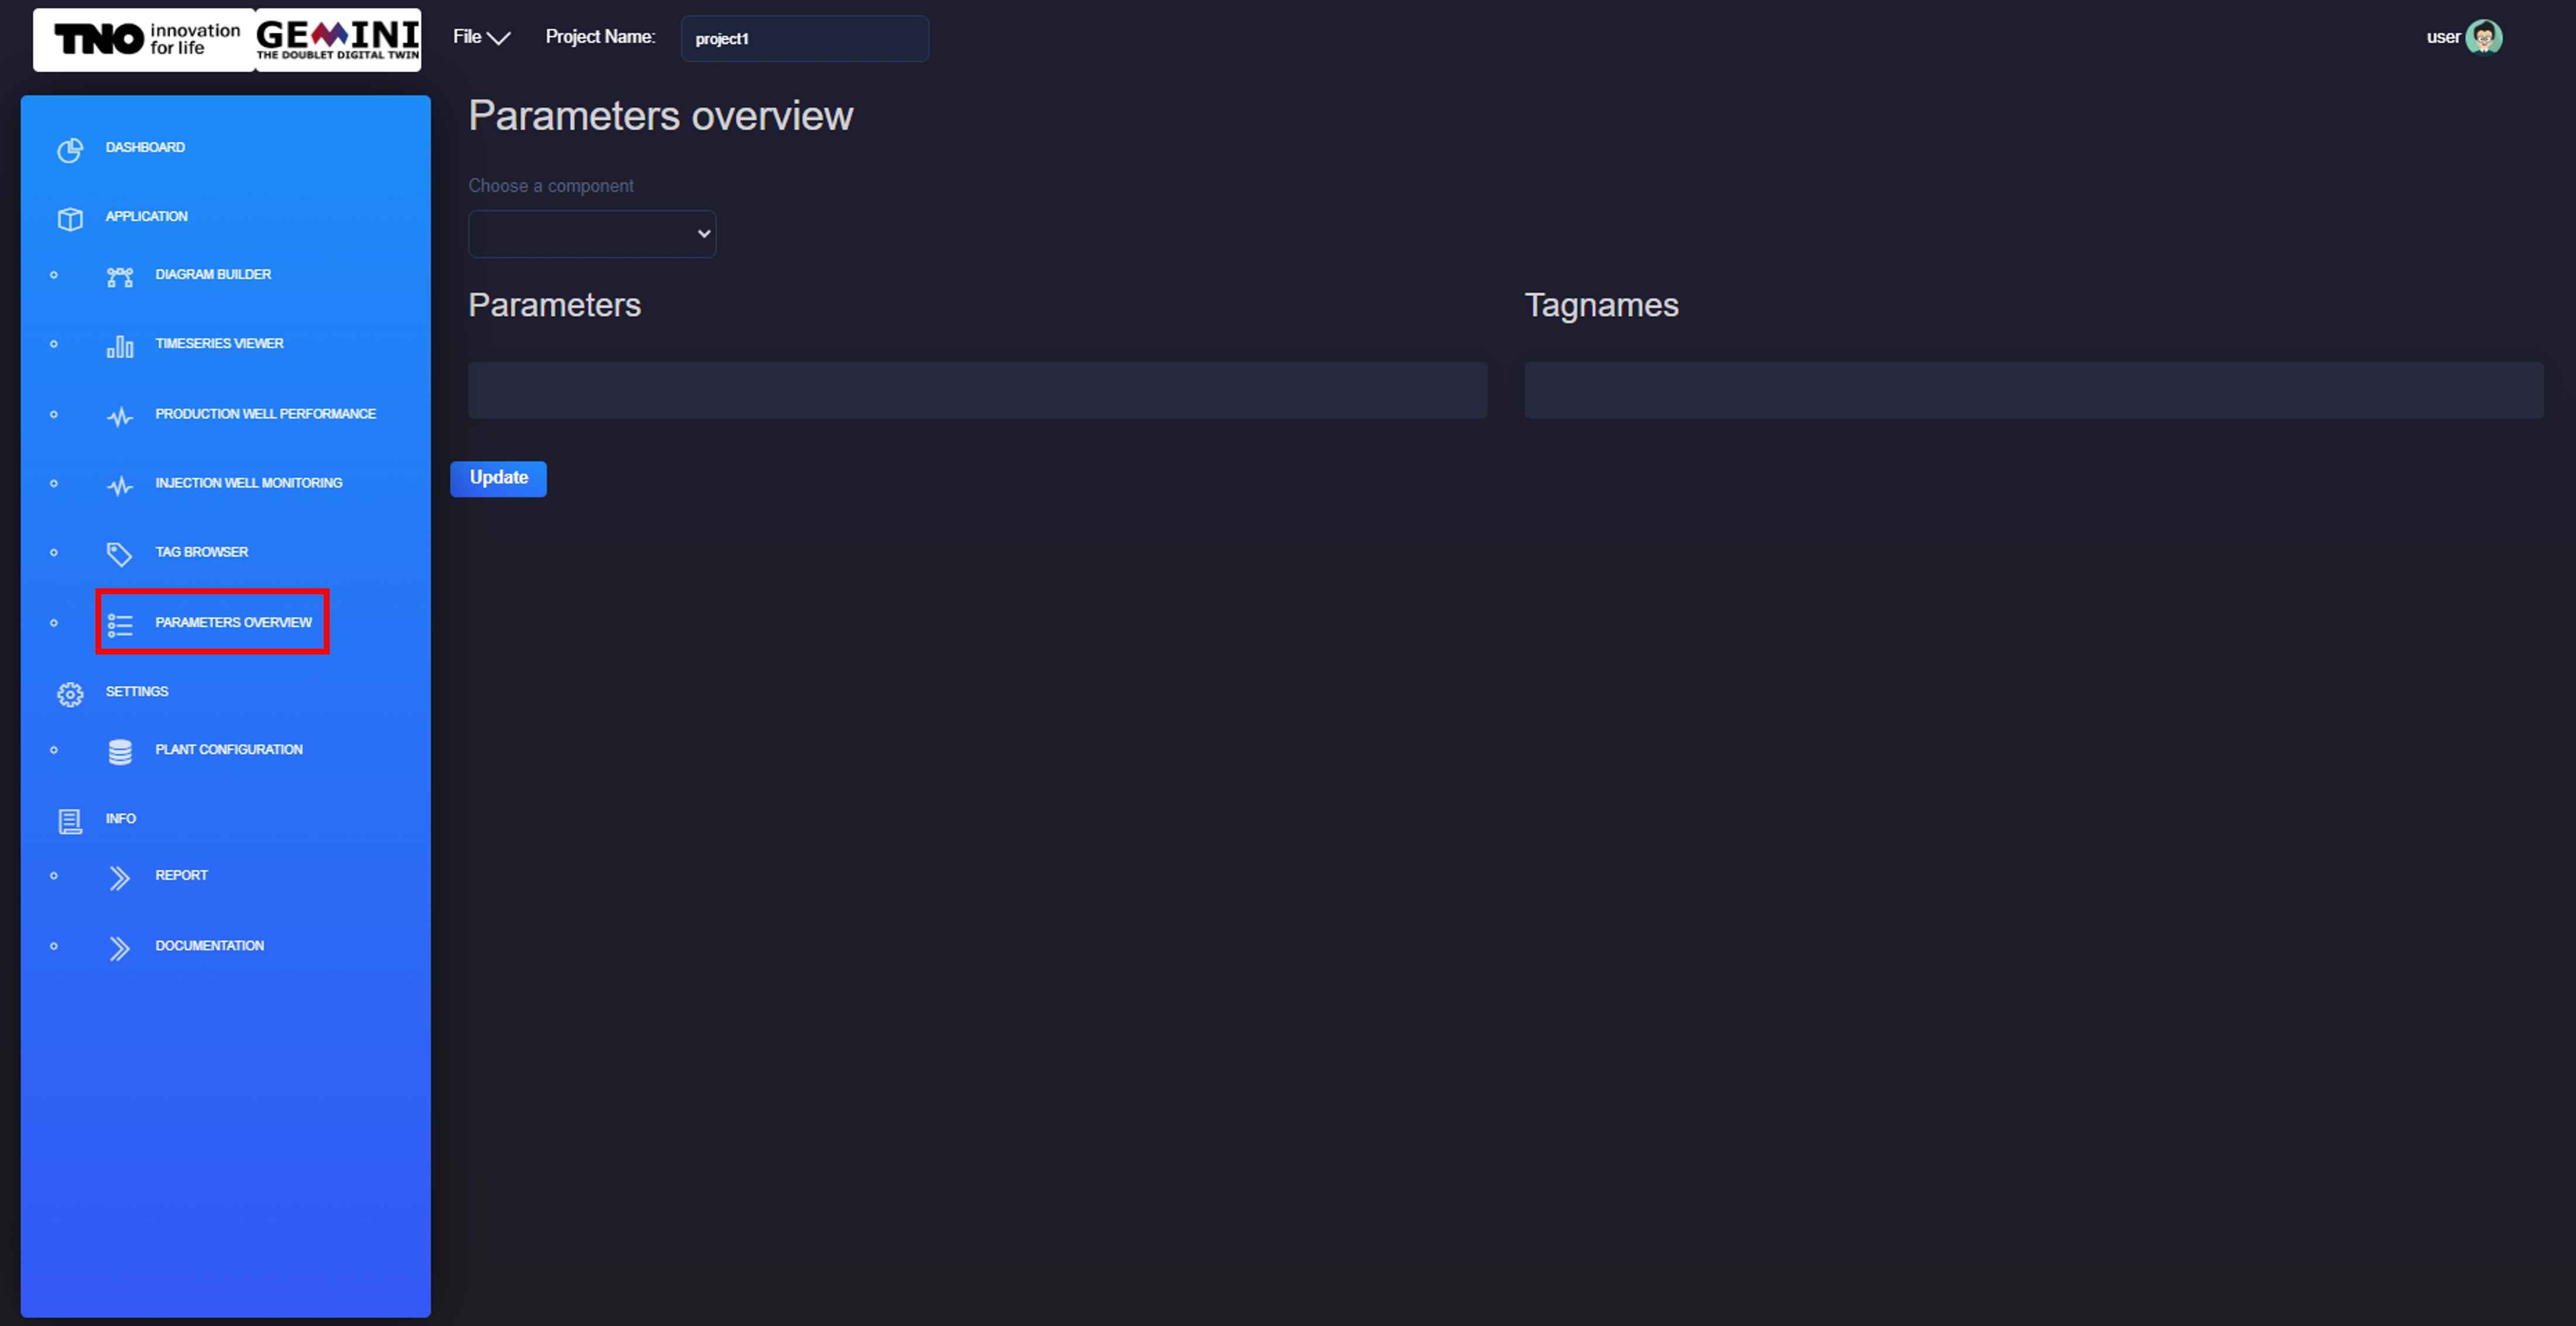
Parameters Overview:
Lists parameters and corresponding tag names in the database related to each component.
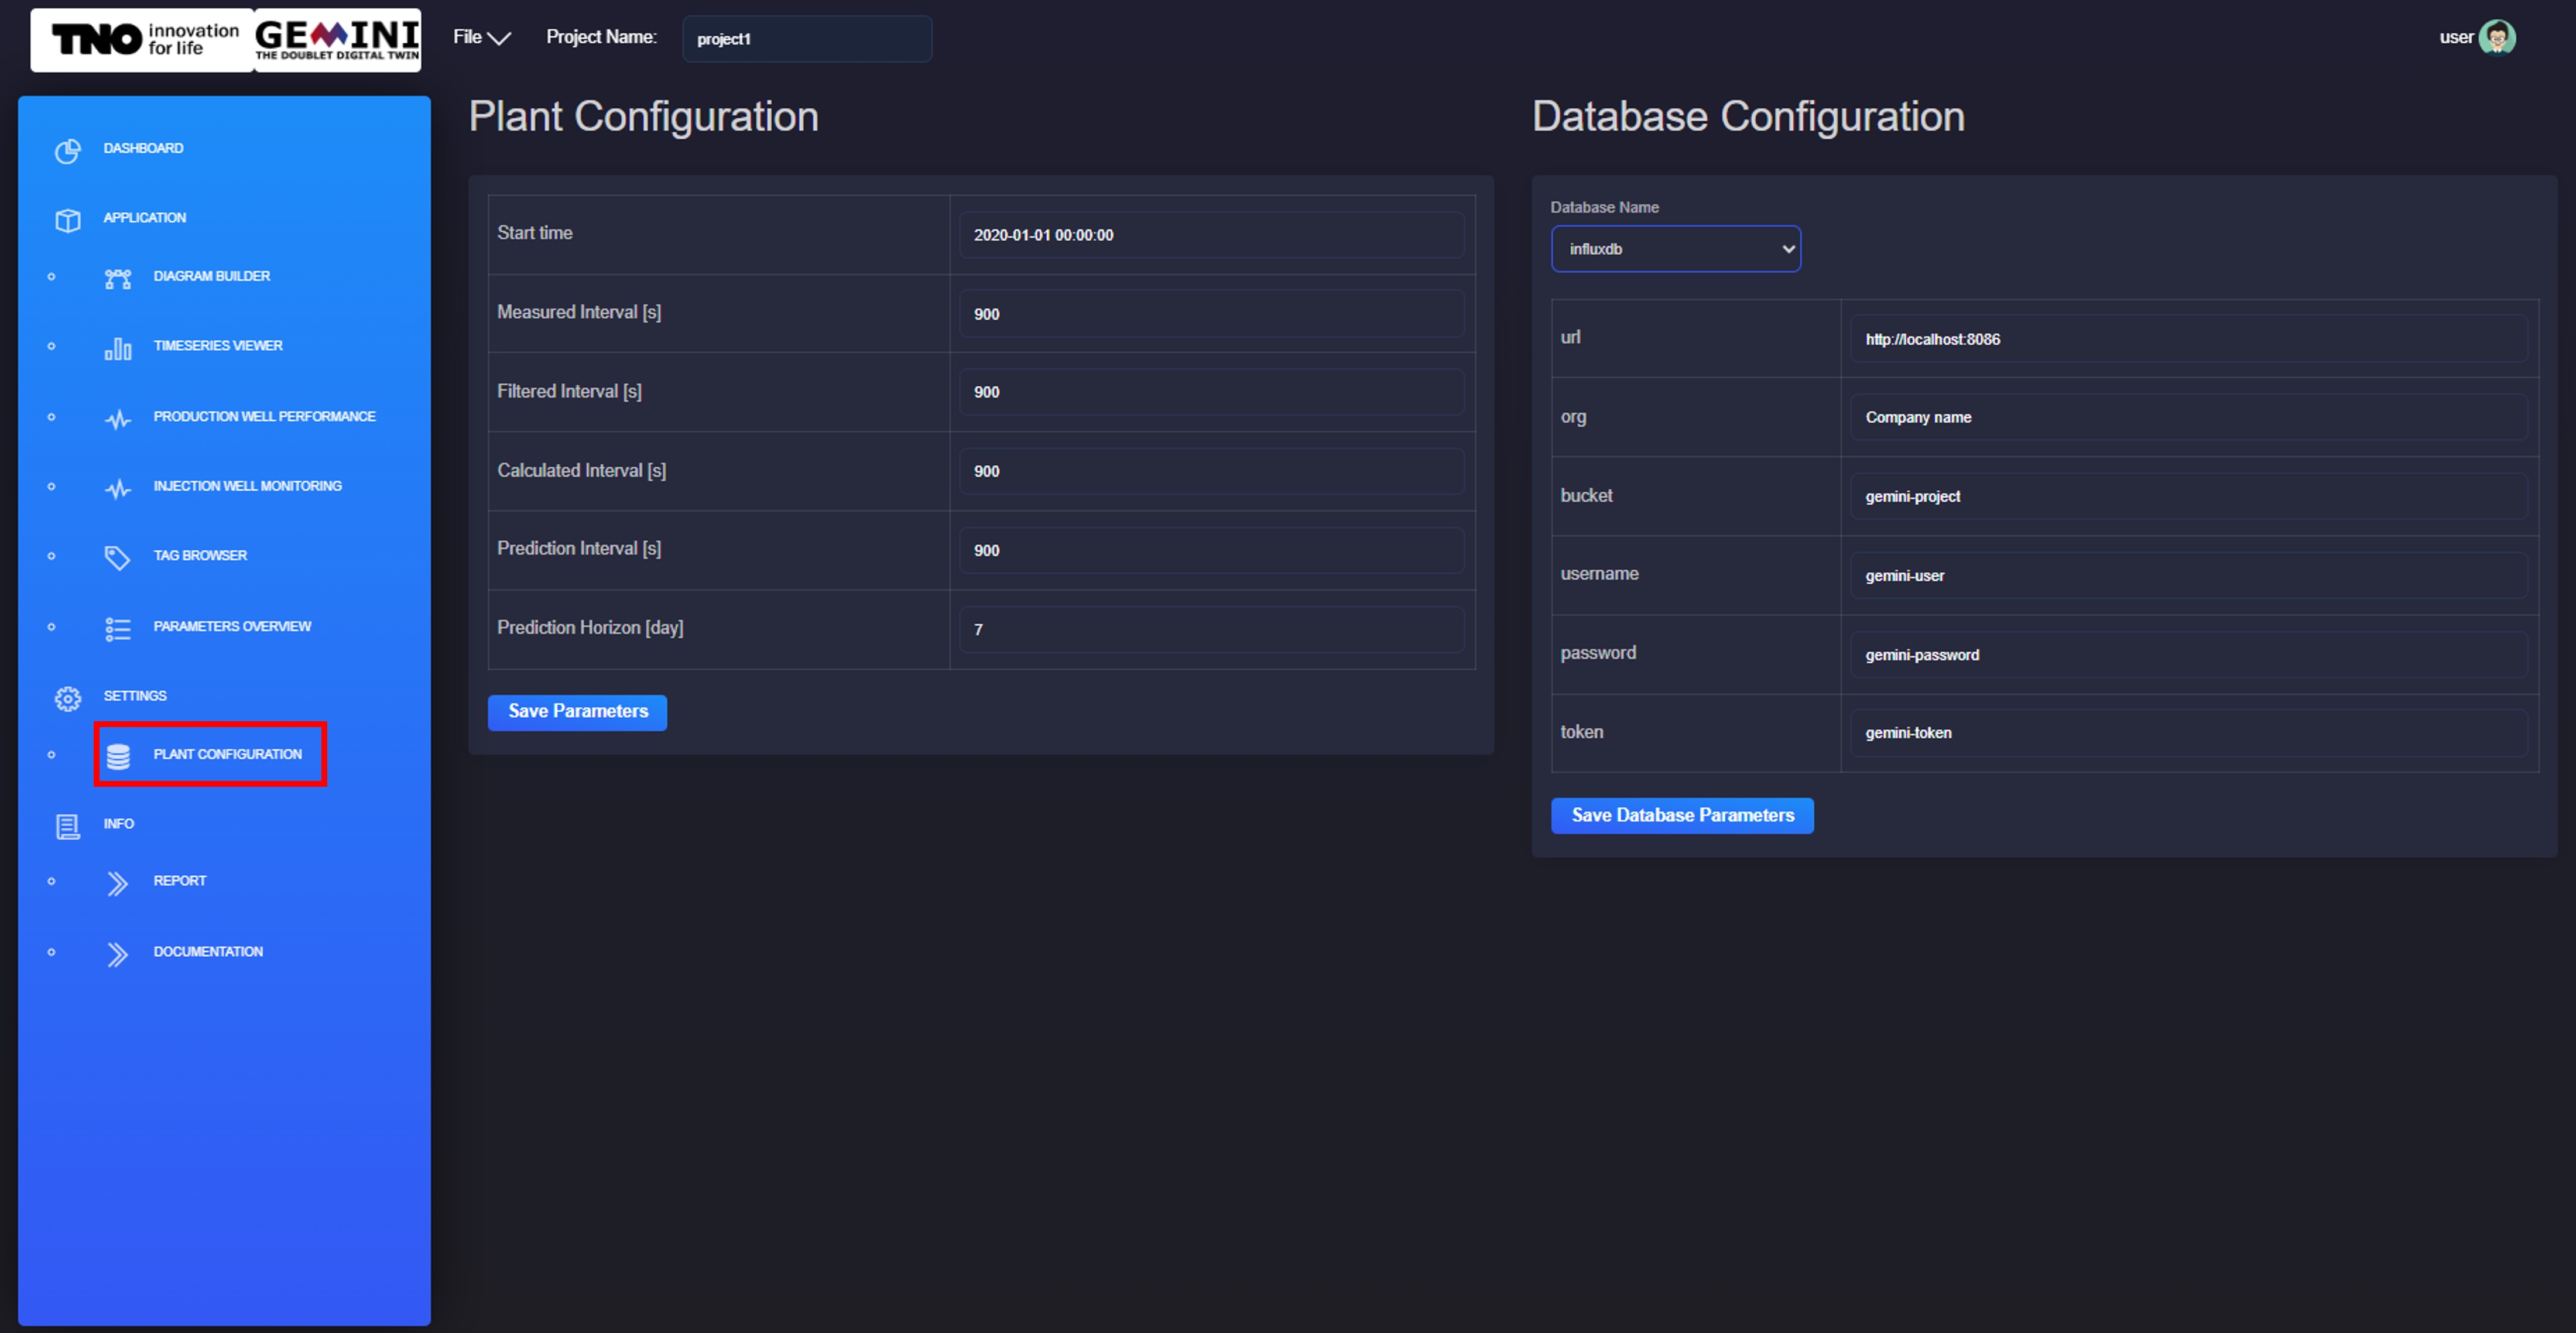
2.3.3. Settings
Plant Configuration:
Set plant and database configurations. Control database access start time and communication speed for reading measured data, preprocessing them, and writing calculated information. Edit database URL, company name, username, passwords, etc.
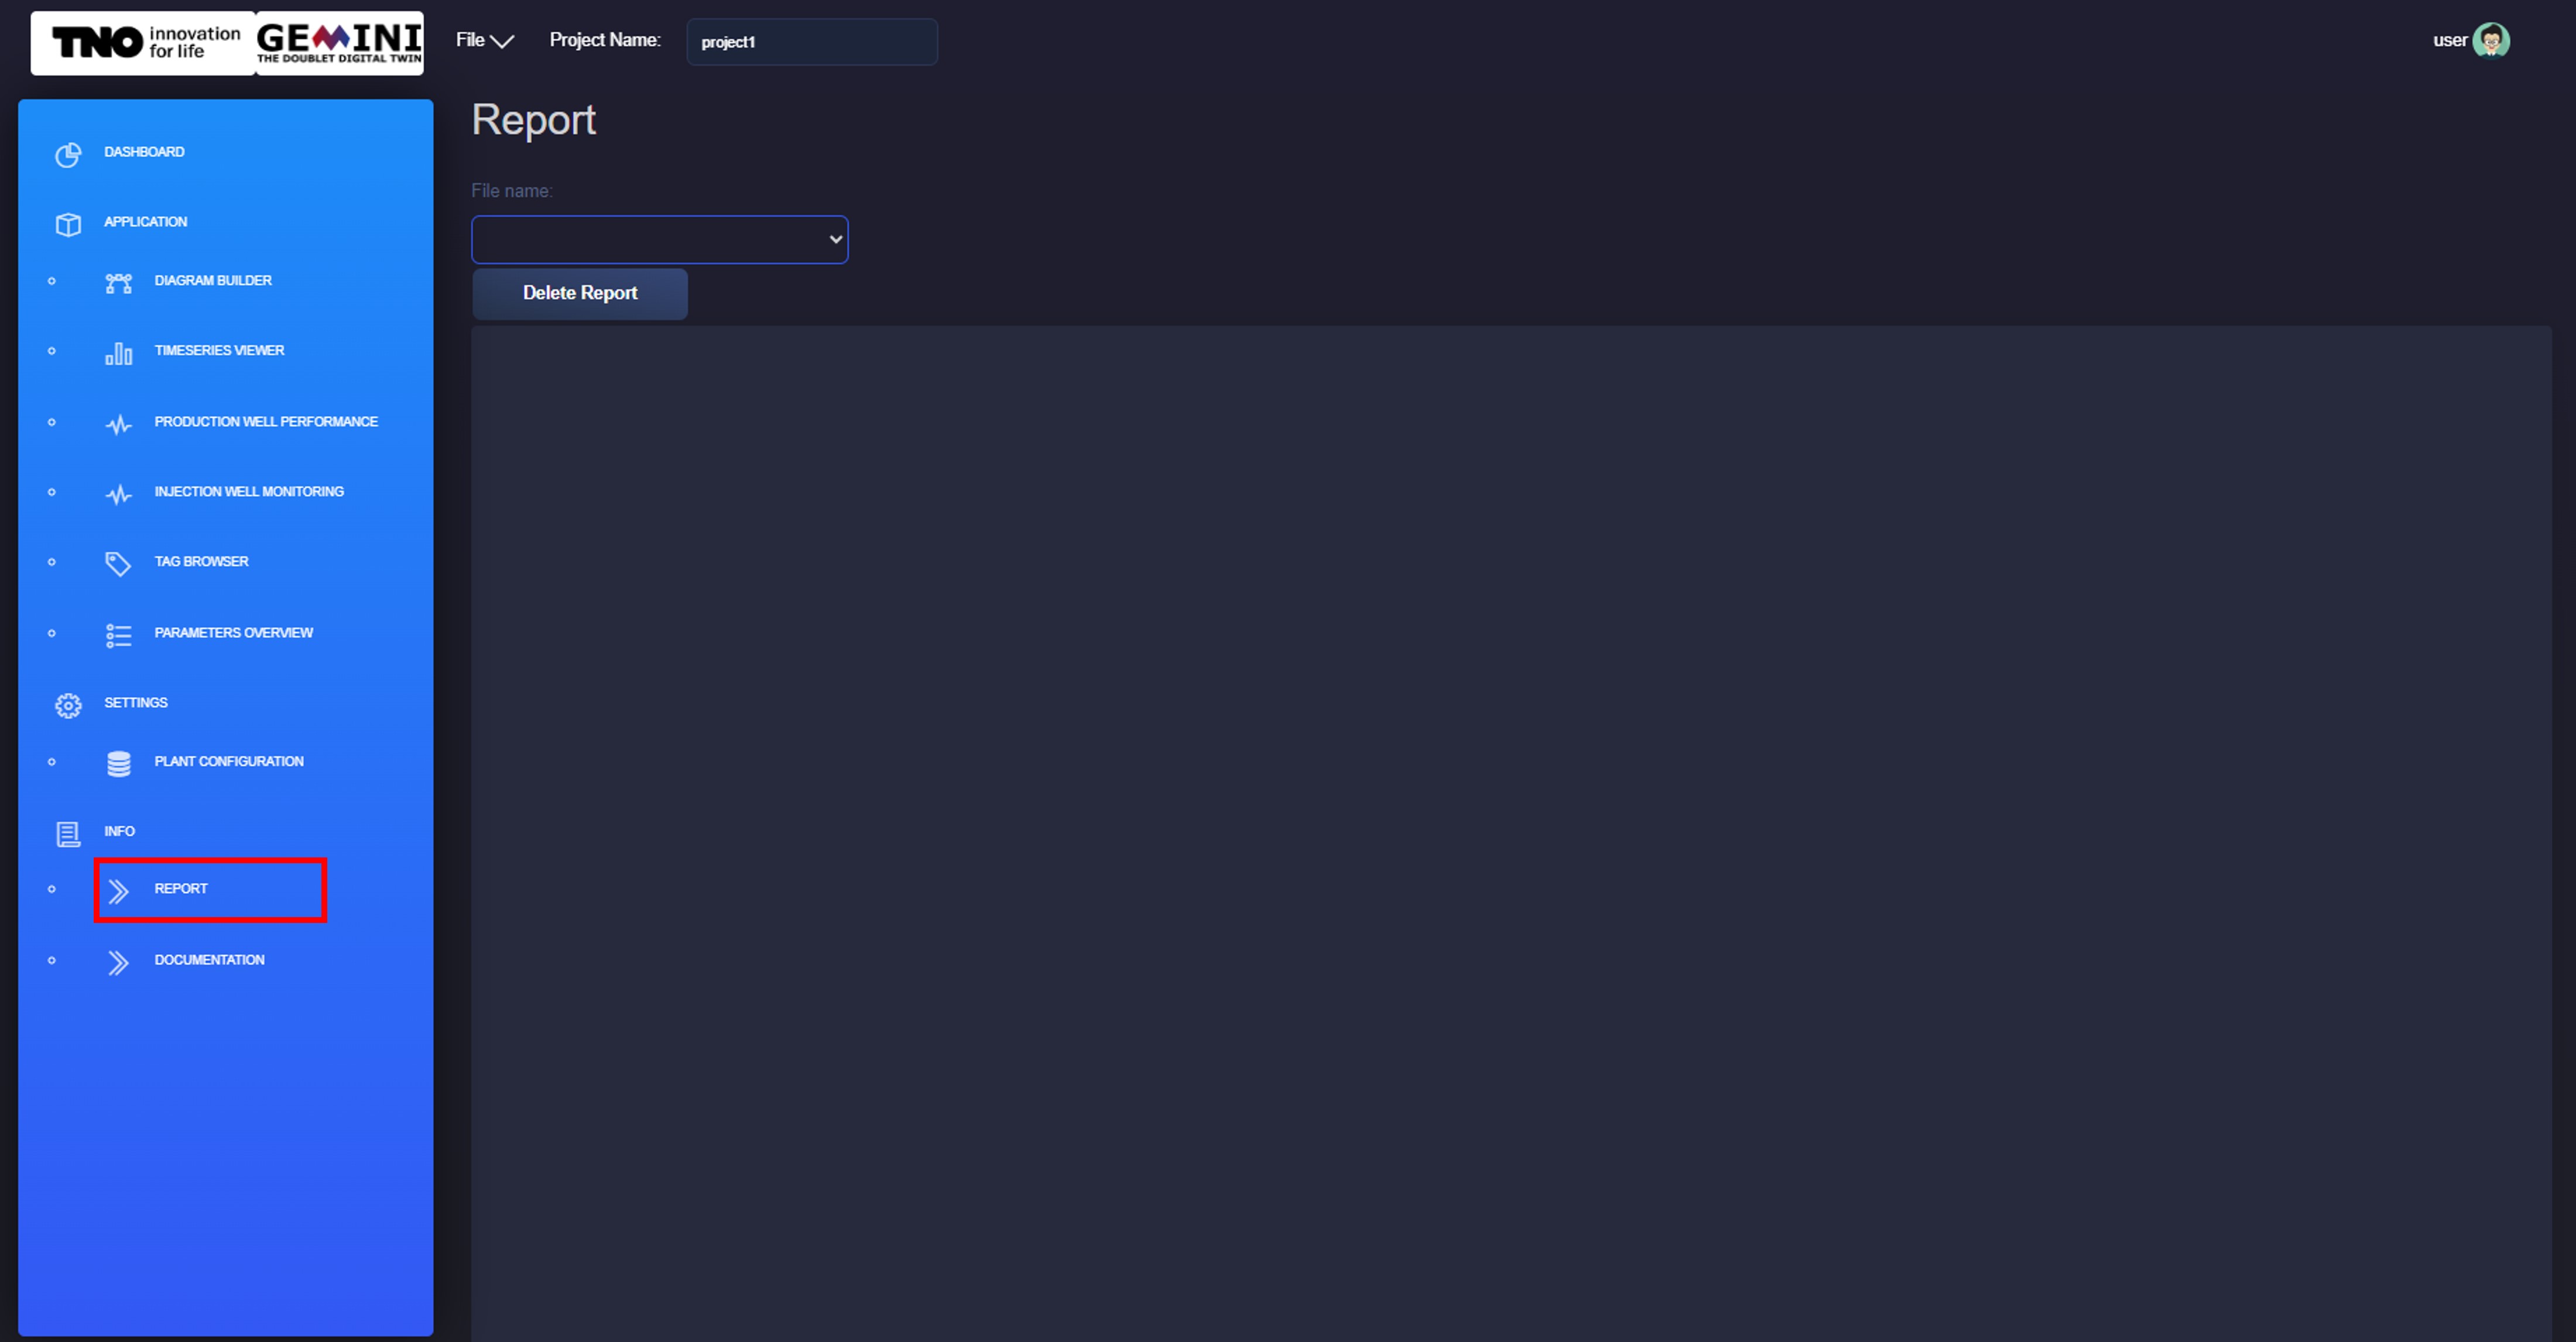
2.3.4. Info
Report:
Access relevant reports (e.g., P&ID of a plant).
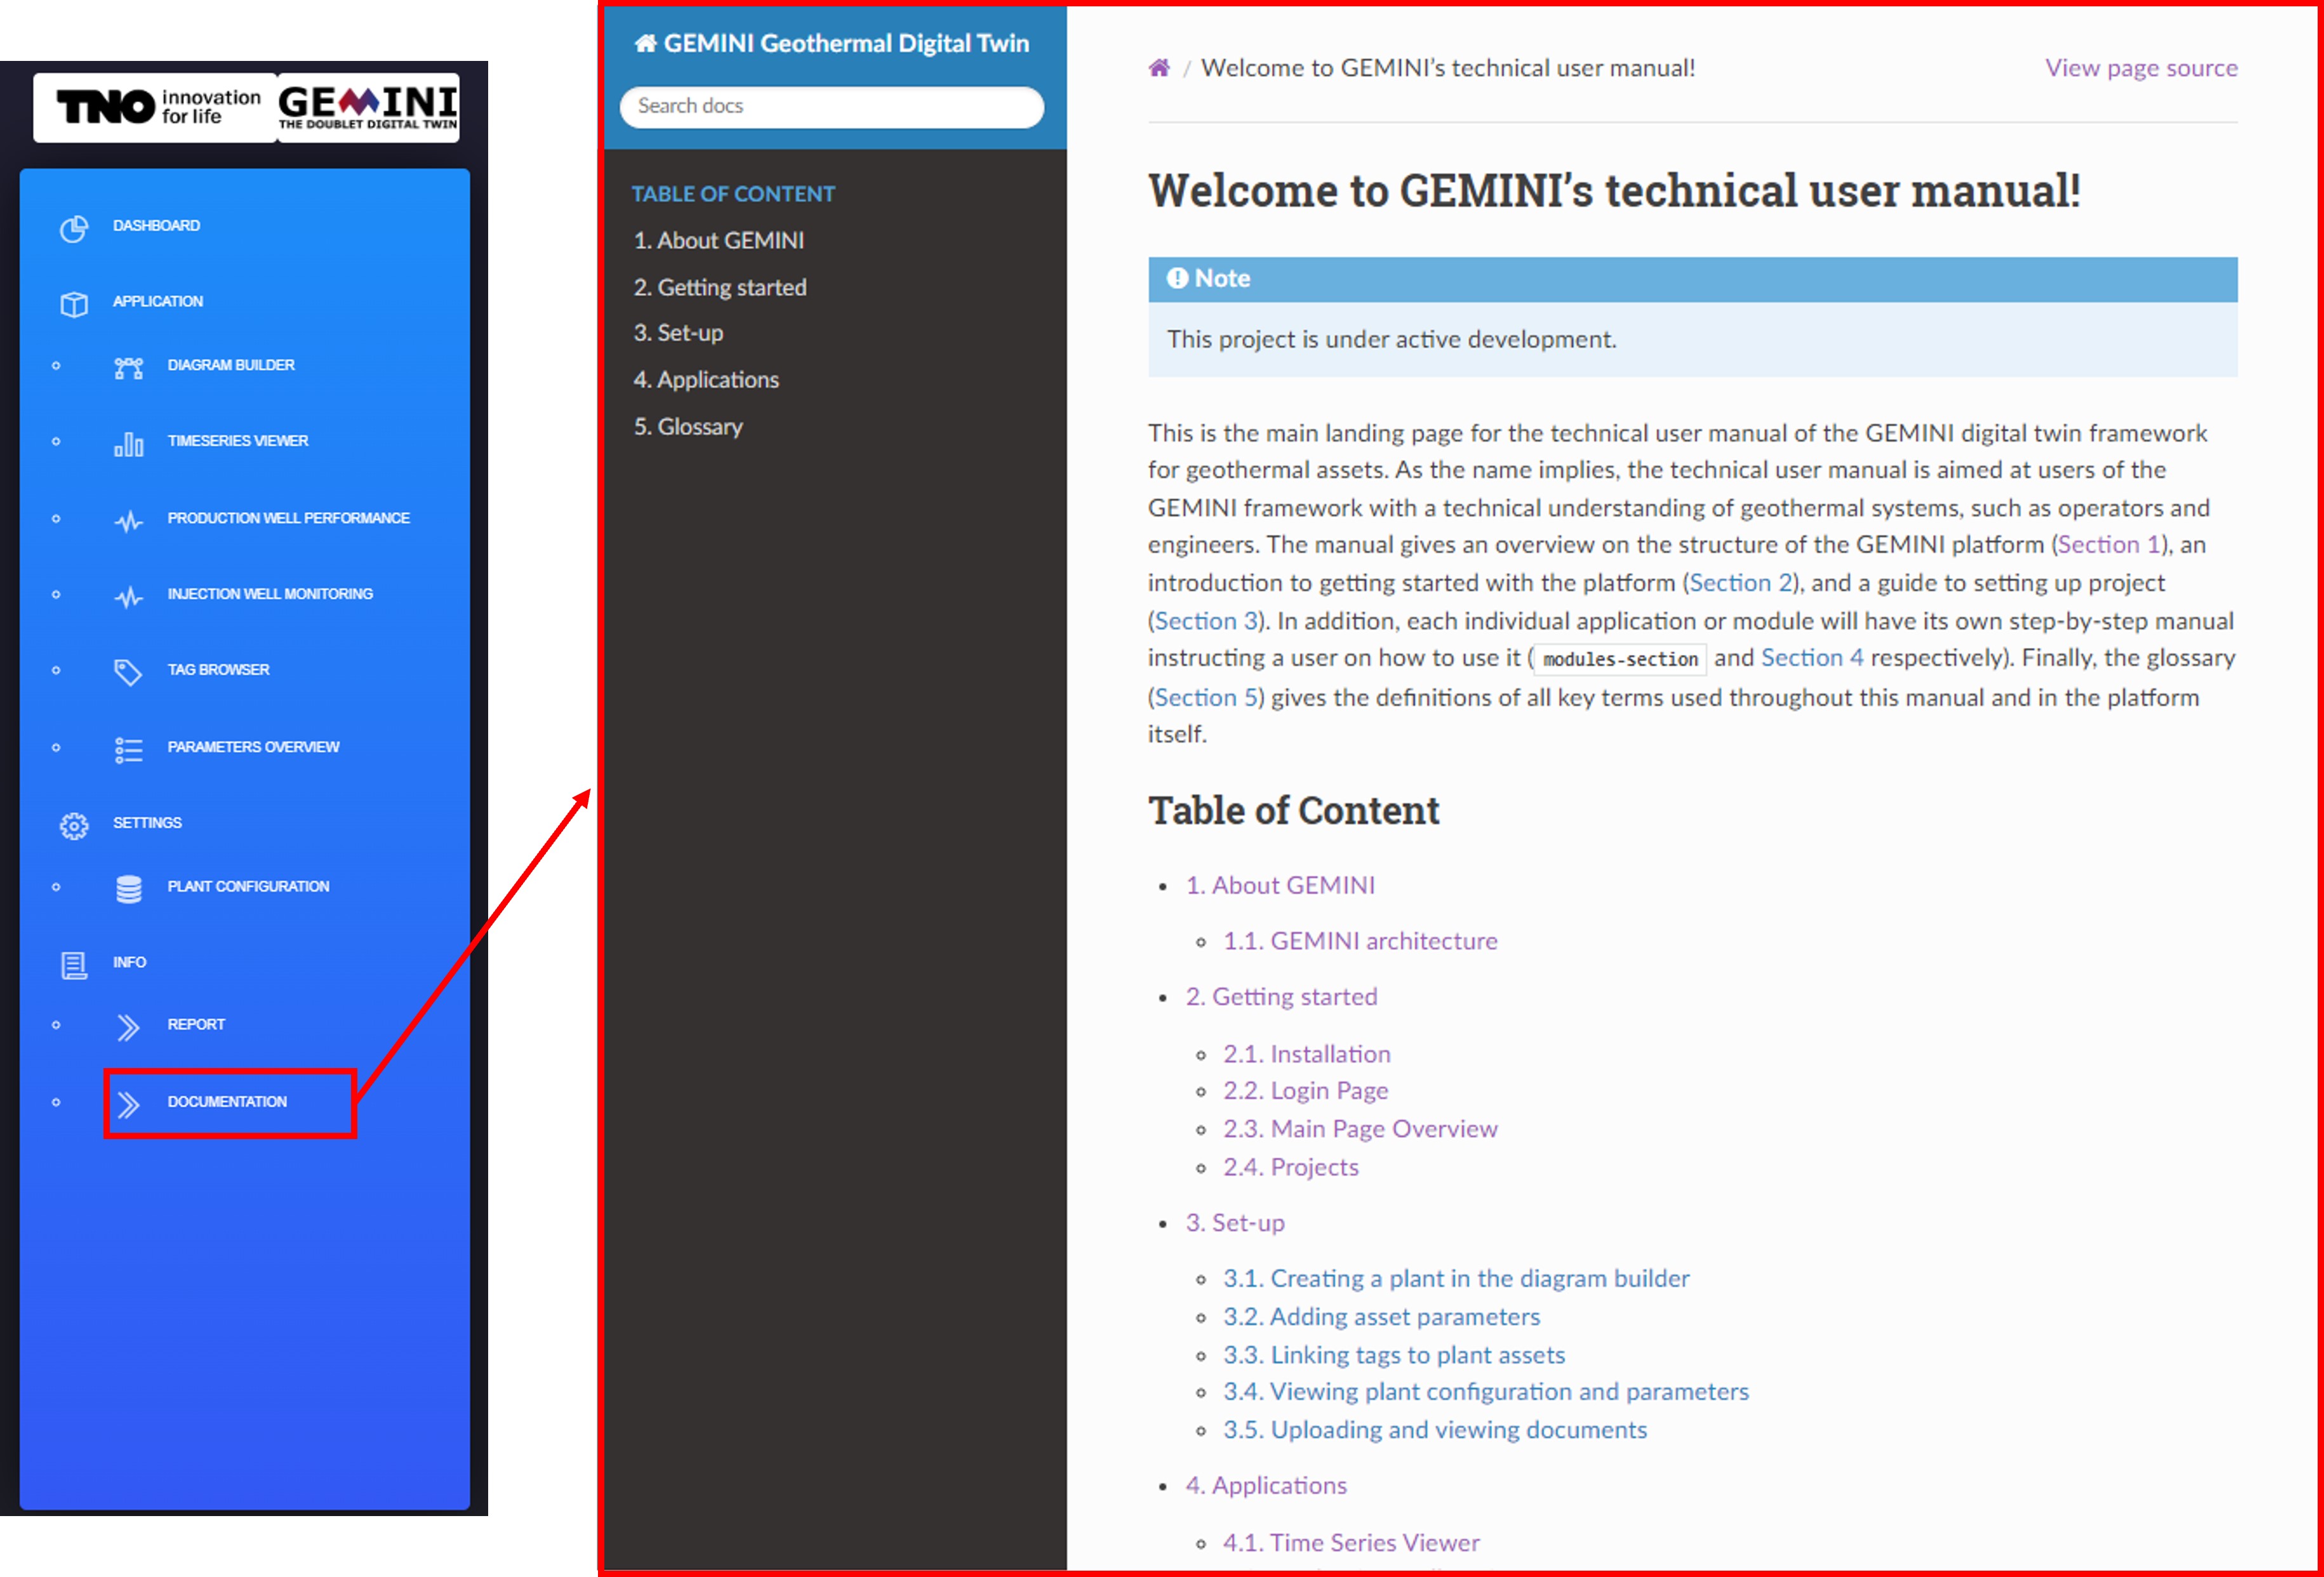
Documentation:
Link to the user manual documentation.